Indians as Immigrant Business Owners

Only Mexican-Americans form a greater share of immigrant business owners than Indian-Americans, as per a new report put out by the Fiscal Policy Institute. There are 62,526 Indian-born business owners, accounting for 7% of the immigrant ownership and 4% of the immigrant labor force. Here’s a finding for skeptics who question the value of immigration: 30% of the growth in small business ownership over the last two decades (1990-2010) was because of immigrants. Of the 4.9 million small business owners in this country, roughly 900,000 are immigrants.
Although only 2% of recent arrivals own small businesses, among Indian immigrants, the number jumps to 9% for well-established Indians. Overall, the rate of ownership is higher for immigrants (3.5%) than it is for the U.S.-born (3.3%). “With immigrants making up one in six of all small business owners, a climate that is hostile to immigrants is also a climate that is bad for business,” states Frank Mauro, executive director of the Fiscal Policy Institute. Among Indian immigrant small business owners, physicians in private practice lead the pack (see table below for the top 10 list). But if we go by broader categories, Retail trade comes first, accounting for 15,528 Indian owners. This includes grocery stores, gas stations, liquor stores, jewelry stores, and pharmacies. Here are the next three categories for Indian immigrants: Educational, health, and social services (13,166); Professional and business services (11,886); Leisure and hospitality (8,943).
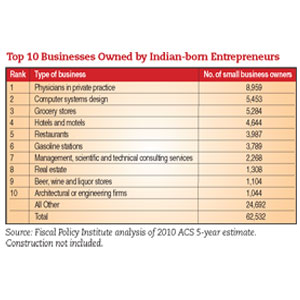
Top 10 Businesses Owned by Indian-born Entrepreneurs
| Rank | Type of Business | No. of small business owners |
| 1 | Physicians in private practice | 8,959 |
| 2 | Computer systems design | 5,453 |
| 3 | Grocery stores | 5,284 |
| 4 | Hotels and motels | 4,644 |
| 5 | Restaurants | 3,987 |
| 6 | Gasoline stations | 3,789 |
| 7 | Management, scientific and technical consulting services | 2,268 |
| 8 | Real estate | 1,308 |
| 9 | Beer, wine and liquor stores | 1,104 |
| 10 | Architectural or engineering firms | 1,044 |
| All Other | 24,692 | |
| Total | 62,532 |
Source: Fiscal Policy Institute analysis of 2010 ACS 5-year estimate.
Construction not included.
Enjoyed reading Khabar magazine? Subscribe to Khabar and get a full digital copy of this Indian-American community magazine.